Μετάφραση και ανάλυση λέξεων από τεχνητή νοημοσύνη
Σε αυτήν τη σελίδα μπορείτε να λάβετε μια λεπτομερή ανάλυση μιας λέξης ή μιας φράσης, η οποία δημιουργήθηκε χρησιμοποιώντας το ChatGPT, την καλύτερη τεχνολογία τεχνητής νοημοσύνης μέχρι σήμερα:
- πώς χρησιμοποιείται η λέξη
- συχνότητα χρήσης
- χρησιμοποιείται πιο συχνά στον προφορικό ή γραπτό λόγο
- επιλογές μετάφρασης λέξεων
- παραδείγματα χρήσης (πολλές φράσεις με μετάφραση)
- ετυμολογία
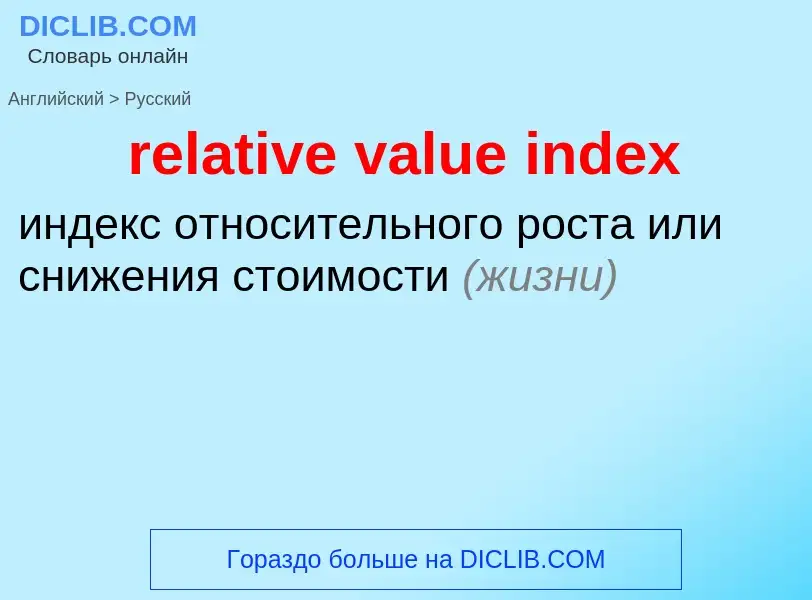
relative value index - translation to ρωσικά
общая лексика
йодное число
иодное число
Ορισμός
Βικιπαίδεια
The relative strength index (RSI) is a technical indicator used in the analysis of financial markets. It is intended to chart the current and historical strength or weakness of a stock or market based on the closing prices of a recent trading period. The indicator should not be confused with relative strength.
The RSI is classified as a momentum oscillator, measuring the velocity and magnitude of price movements. Momentum is the rate of the rise or fall in price. The relative strength RS is given as the ratio of higher closes to lower closes. Concretely, one computes two averages of absolute values of closing price changes, i.e. two sums involving the sizes of candles in a candle chart. The RSI computes momentum as the ratio of higher closes to overall closes: stocks which have had more or stronger positive changes have a higher RSI than stocks which have had more or stronger negative changes.
The RSI is most typically used on a 14-day timeframe, measured on a scale from 0 to 100, with high and low levels marked at 70 and 30, respectively. Short or longer timeframes are used for alternately shorter or longer outlooks. High and low levels—80 and 20, or 90 and 10—occur less frequently but indicate stronger momentum.
The relative strength index was developed by J. Welles Wilder and published in a 1978 book, New Concepts in Technical Trading Systems, and in Commodities magazine (now Modern Trader magazine) in the June 1978 issue. It has become one of the most popular oscillator indices.
The RSI provides signals that tell investors to buy when the security or currency is oversold and to sell when it is overbought.
RSI with recommended parameters and its day-to-day optimization was tested and compared with other strategies in Marek and Šedivá (2017). The testing was randomised in time and companies (e.g., Apple, Exxon Mobil, IBM, Microsoft) and showed that RSI can still produce good results; however, in longer time it is usually overcome by the simple buy-and-hold strategy.


