Tradução e análise de palavras por inteligência artificial ChatGPT
Nesta página você pode obter uma análise detalhada de uma palavra ou frase, produzida usando a melhor tecnologia de inteligência artificial até o momento:
- como a palavra é usada
- frequência de uso
- é usado com mais frequência na fala oral ou escrita
- opções de tradução de palavras
- exemplos de uso (várias frases com tradução)
- etimologia
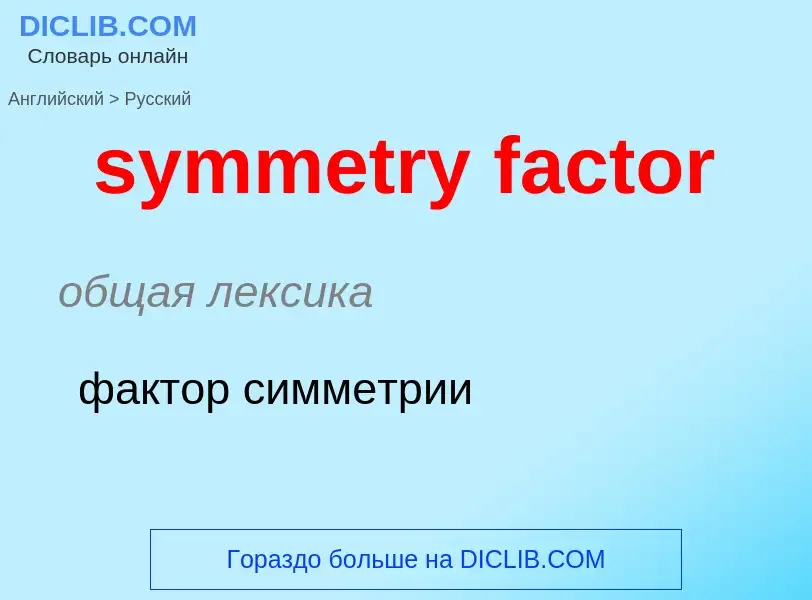
symmetry factor - tradução para russo
общая лексика
фактор симметрии
математика
локальная симметрия
математика
внутренняя симметрия
Definição
Wikipédia
In theoretical physics, a Feynman diagram is a pictorial representation of the mathematical expressions describing the behavior and interaction of subatomic particles. The scheme is named after American physicist Richard Feynman, who introduced the diagrams in 1948. The interaction of subatomic particles can be complex and difficult to understand; Feynman diagrams give a simple visualization of what would otherwise be an arcane and abstract formula. According to David Kaiser, "Since the middle of the 20th century, theoretical physicists have increasingly turned to this tool to help them undertake critical calculations. Feynman diagrams have revolutionized nearly every aspect of theoretical physics." While the diagrams are applied primarily to quantum field theory, they can also be used in other areas of physics, such as solid-state theory. Frank Wilczek wrote that the calculations that won him the 2004 Nobel Prize in Physics "would have been literally unthinkable without Feynman diagrams, as would [Wilczek's] calculations that established a route to production and observation of the Higgs particle."
Feynman used Ernst Stueckelberg's interpretation of the positron as if it were an electron moving backward in time. Thus, antiparticles are represented as moving backward along the time axis in Feynman diagrams.
The calculation of probability amplitudes in theoretical particle physics requires the use of rather large and complicated integrals over a large number of variables. Feynman diagrams can represent these integrals graphically.
A Feynman diagram is a graphical representation of a perturbative contribution to the transition amplitude or correlation function of a quantum mechanical or statistical field theory. Within the canonical formulation of quantum field theory, a Feynman diagram represents a term in the Wick's expansion of the perturbative S-matrix. Alternatively, the path integral formulation of quantum field theory represents the transition amplitude as a weighted sum of all possible histories of the system from the initial to the final state, in terms of either particles or fields. The transition amplitude is then given as the matrix element of the S-matrix between the initial and final states of the quantum system.


